Kriterion vs MacroFactor
Both apps do the same unusual thing: measure your maintenance calories from what you actually logged and actually weighed, instead of handing you a formula and calling it a day. MacroFactor is the reason anyone does that at all. Where the two part company is in how the number is actually built, and in what each app is willing to tell you about how firm it is.
Kriterion measures maintenance because MacroFactor proved it was worth doing. But we did not copy the method. We took the idea and rebuilt it, and we think what came out is a genuine refinement rather than a second implementation of the same thing. The credit for making this the standard rather than a niche trick still belongs to them, and their expenditure graph is built with real care.
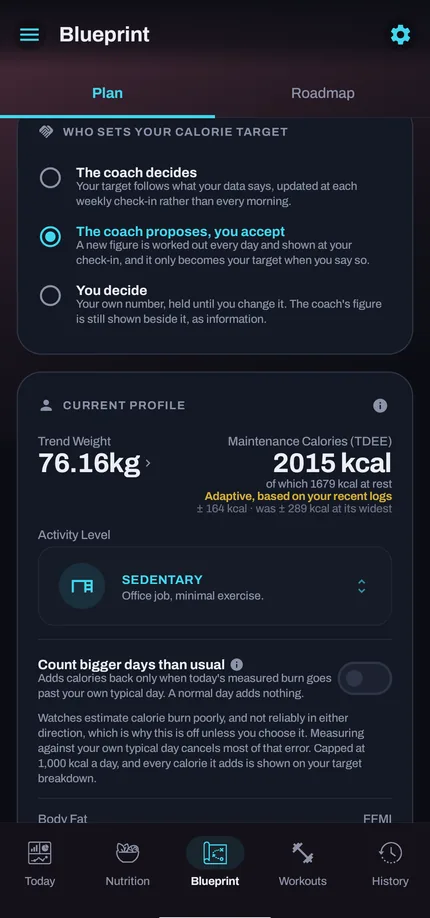
The difference, on one screen Both apps arrive at a maintenance figure the same way. Only one of them shows its working. The large figure is what this person burns on an average day. Eat that, hold your weight. The margin beside it says how cleanly that came out of their weigh-ins: tens of calories rather than hundreds, so the scale data is telling a consistent story rather than a noisy one. The figures shown are from a seeded demo account, not a real person.
| Kriterion | MacroFactor | |
|---|---|---|
| TDEE method | Measured from logged intake vs. weight trend, weighted towards your recent weeks so it turns with you | Measured from logged intake vs. weight trend |
| Shows its error margin | Yes, shown as a spread either side of the figure, so you can see how firm the number is | Not published. You're asked to trust the number once it has stabilised. |
| Checks its own accuracy | Yes. Replays its past predictions against what your scale actually did, and tells you the gap | Not offered |
| Water-retention handling | Weigh-ins during a creatine loading phase are excluded from the trend | Not documented |
| Free tier | Logging is free and unlimited, permanently, with no card required | None. Every feature sits behind a subscription; the only free access is a trial |
| Training | Built in: sets, reps, RIR, readiness, a HIIT timer with spoken cues | A separate app in their bundle, not part of MacroFactor itself |
| Menstrual cycle tracking | Built in, shown beside readiness as context for training | Not offered |
| Food database | UK government lab data (CoFID), USDA, Open Food Facts, plus real UK and Ireland chain menu items from the figures those chains publish, each entry badged by how its numbers were produced | A large, community-verified database, strongest on US packaged foods |
| Logging speed | 13 actions overall on MacroFactor's own published FLSI benchmark (see below) | 24 actions, MacroFactor's own published score |
| Platforms | iOS, Android, Apple Watch, Wear OS | iOS, Android |
Kriterion is newer. What it brings is a wider brief, food, training and recovery reasoning about each other rather than sitting in separate apps, and a free tier that lets you find out whether that brief is worth anything to you before paying for it.
What the ± actually tells you
Every calorie app hands you one number. The problem with one number is that it hides how much of a guess it is: “1,870” looks identical whether the app has three months of your data or three days.
So Kriterion shows the spread too. A tight one means your weigh-ins agree with each other, so the figure drawn from them is well pinned. A spread of ± 300 would mean the opposite: too much scatter to act on yet, which is worth knowing before you cut your calories on the strength of it.
“95%” just means 19 times out of 20. Run the same maths on twenty people whose weigh-ins are this consistent, and you would expect the trend figure to land inside the stated range for nineteen of them. It is the strictest of the standard intervals, which is why ours reads wider than it strictly needs to. We would rather that than the reverse.
In practice it settles in the low hundreds of kcal, and it is worth being straight about why: what limits it is how much a bathroom scale jumps about from one week to the next, not how hard the app is working. No amount of cleverness gets past that, in this app or any other. It narrows over your first couple of months and then holds, and an app that showed you that number shrinking forever would be showing you something it had made up.
So the number worth watching is the other one. Alongside the spread, Kriterion grades its own past predictions against what your scale actually went on to do, and reports how tightly that grade is pinned down. Unlike the spread, that figure genuinely keeps sharpening the longer you log, because it is built on months of your results rather than on one week of scale readings.
Those two are measured, not illustrated. But they are measured against simulated users whose true expenditure we set ourselves, because on a real person nobody knows the true answer, which is exactly why no app in this category can show you a figure like this from real accounts. Yours will differ. The point is the direction and the size: the app's read on its own accuracy lands in the tens of kcal a day, and you can watch it get there.
What it does not claim. A tight spread means your scale data is consistent. It does not mean the number is right. The bigger error in any app like this is under-reported food and the tracking literature puts it at 20% or worse. That is a systematic bias, not random scatter, so nothing in your logged data can measure it and no honest interval can include it. Kriterion would rather say that plainly than hand you a range that quietly implies more than it knows.
So we check ourselves against your results instead
If no app can prove its calorie number is true, the next honest thing is to prove whether acting on it worked. So Kriterion grades its own homework. It repeatedly replays what it believed your maintenance was at points across your history, using only the data it had at each of them, works out what the scale should have done given what you actually ate, and fits the gap between that and what the scale did. It is one fit across the whole history rather than a run of separate exams, so it re-cuts as each new day of data lands and sharpens as the history lengthens.
The result sits under your maintenance figure in plain words: that results have been running ahead of the plan, behind it, or tracking it closely. It is a measured statement about your own history rather than a claim about metabolism in general, and as far as we can tell no other app in this category publishes one. It waits until there are about six weeks of results to fit against and stays quiet until then rather than showing a placeholder, after which it re-cuts with every day that lands. From your first week the same card reports how much of the target is already your own measurement rather than the formula it started as.
Two things it deliberately does not do. It does not pretend to know why a gap appeared. Expenditure, logging drift and weigh-in conditions all produce the same arithmetic, and the honest answer is that this cannot tell them apart. And it does not act on the whole of a gap while the error bar around it is still wide, so an early reading nudges the target rather than yanking it.
There is a quiet upside worth knowing about, too. If you under-log by a consistent amount, the target is expressed in your logging units, so you eat to it as you log it, and the weight moves as predicted anyway. That is the real reason a measured target beats a formula, and it is the sense in which this one is accurate: not that it knows your true expenditure, but that following it produces what it said it would.
Under the hood it is a 95% confidence interval on the expenditure estimate itself, taken straight from what the engine currently believes rather than approximated from a fitted window, which is why it widens on its own through a gap in your logging, where an interval drawn around a trend line would have held still. You never need to think in those terms. Before you have a month of history the app still shows you a figure, because you need something to eat to on day three, but it labels it as still calibrating, and leans that figure much more heavily on the standard formula until your own data has earned the weight.
Why the creatine detail is here at all
Three pounds of water retention during a creatine loading phase is not three pounds of fat gained, but a naive weight-trend algorithm can't tell the difference and will quietly shave calories off your target for no reason. Kriterion excludes those weigh-ins from the trend calculation. It's a small thing, and it's exactly the kind of small thing that decides whether a measured number is trustworthy or not.
Logging speed, scored on MacroFactor's own test
MacroFactor publishes a real methodology for this, the Food Logging Speed Index (FLSI): four scenarios, each scored in discrete actions (taps, clicks or selections; typing digits into an already-focused field doesn't count as one). We ran Kriterion through the identical four scenarios, not a looser comparison.
| Scenario | Kriterion | MacroFactor (published) |
|---|---|---|
| Search, non-default serving + 3-digit qty | 5 | 10 |
| Multi-Add (re-log a previous food) | 2 | 6 |
| Barcode, non-default serving + 3-digit qty | 4 | 5 |
| Quick-Add Calories, no food name | 2 | 3 |
| Overall | 13 | 24 |
The MacroFactor numbers are theirs, self-published and taken as given, not independently re-timed by us. The Kriterion numbers are measured against the same scenario definitions: Search and Barcode both require changing the serving size to a non-default unit and entering a three-digit quantity; Multi-Add uses default servings; Quick-Add requires logging a calorie figure with no food name attached at all, which Kriterion's manual entry genuinely allows.
Re-logging a food you've eaten before is where the gap is largest, and it isn't an accident. MacroFactor's own algorithm depends on consistent logging to stay accurate, and so does Kriterion's. The single best way to keep someone logging consistently is to make the thing they do most often, log the same breakfast again, cost as little effort as possible.